- Great margins, consistent earnings and strong growth put Ferrari ahead of its competitors
- Disciplined cost control further increases the appeal of a financially healthy business
- Ferrari might be the most attractive European car manufacturer to invest in right now
In this article we are going to perform a business health analysis of Ferrari using our custom scoring model to assess whether the company presents an appealing opportunity for blue chip value investors that are looking to buy great businesses at great prices.
“Born of the spirit of racing, Ferrari epitomises the power of a lifelong passion and the beauty of limitless human achievement, creating timeless icons for a changing world.”
Ferrari N.V. (NYSE: RACE) is a world-renowned luxury sports car manufacturer headquartered in Maranello, Italy. Founded in 1939 by Enzo Ferrari, the company is celebrated for its high-performance vehicles, iconic design, and rich racing heritage. Ferrari maintains a strong brand identity rooted in exclusivity, craftsmanship, and innovation, producing a limited number of vehicles each year to preserve its elite status. The company operates globally, serving a wealthy clientele and expanding its lifestyle offerings through branded merchandise and experiences. Ferrari’s strong margins, loyal customer base, and disciplined growth strategy make it an attractive option for investors seeking luxury sector exposure.
Margins: 5 of 5 possible points
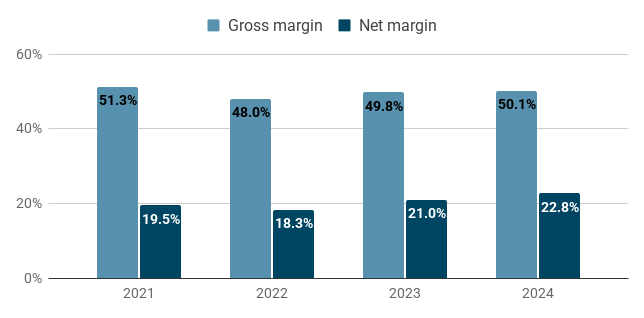
50% gross margin – that is a great performance for a company and stellar result for a car manufacturer. That begs the question: Could that have something to do with the hefty price tag attached to the cars from Maranello? After all, the amount and variety of materials used for making cars only varies so much between different models. And indeed, if we look at other big European car manufacturers, we find a striking trend between the average price of their vehicles and the gross margins of the company:
- Stellantis: 20%
- Renault: 19%
- Volkswagen: 19%
- BMW: 18%
- Mercedes-Benz: 23%
- Porsche: 27%
- Aston Martin: 35%
On top of that, the gross margin has been quite consistent, varying only between 48% and 51%. With a net margin of 20%, Ferrari puts itself right on the edge of what we consider great performance for a business to invest in. More importantly, the net margin has been increasing over time: From 19.5% in 2021 to 22.8% in 2025.
Earnings: 4 of 4 possible points
Just as it does on margins, Ferrari scores full points again on earnings. Net income has been consistent and growing – on average by 21% per year. Earnings in 2024 (€1.52bn) are almost double of the earnings three years prior (€0.83bn). We also observe a similar growth trend for return on equity: growing from 38% in 2021 to 43% in 2024. And even the lowest value (36% in 2022) is far above our threshold of 25% that we are looking for in a great business to invest in.

Expenses: 2 of 4 possible points
To assess expenses we are going to look at two ratios: SG&A expenses as a percentage of gross profit and capital expenditures as a percentage of earnings. Ferrari had absolute SG&A expenses between €348m in 2021 and €560m in 2024. The median SG&A expense rate during those four years has been 16% and it has been remarkably constant. That means that these overhead expenses are scaled and managed in lockstep with top line growth. As before, 16% is a great performance for a company, but it will look even more impressive, when we consider that the majority of car manufacturers spend between 40% and 60% of their gross profit for these operating expenses.

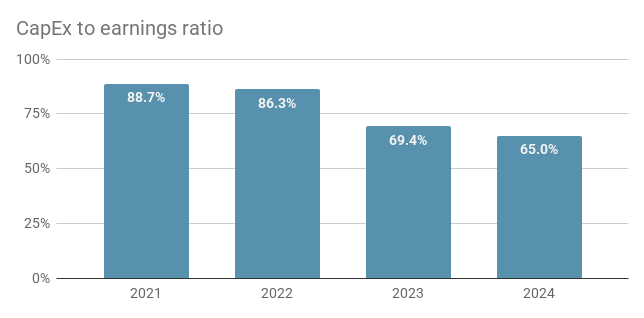
When we consider capital expenditures the picture looks expectedly less rosy. With a median of 78% of earnings spent on capital expenditures Ferrari is significantly above the 25% that we would like to see in a great business. However, this can be expected for a capital intensive manufacturing business. The silver lining is that the ratio is actually improving over time:
- In 2021 Ferrari had capital expenditures of €737m against earnings of €831m, thus, it spent almost 89% of its earnings.
- In 2024, both capital expenditures and earnings have increased. The expenses grew by 34% to €989m but earnings grew by 83% to 1.52bn.
- As a result the percentage of earnings required to cover capital expenditures has decreased to 65%
Debt and Equity: 3 of 6 possible points
On the equity side, retained earnings for Ferrari have grown consistently over the past four years. From €2.2bn in 2021 to €3.5bn in 2024 – an average annual growth of 16%.

When we look at the total liabilities to equity ratio, we find a median value of 1.84 for the past four years. This is far above the limit of 0.8 that we are looking for in an ideal business to invest in and also above the tolerable maximum of 1.5. However, we observe a positive trend towards lower ratios: It decreased from a high value of 2.11 in 2021 to 1.68 in 2024. That means that if earnings and equity keep growing as in recent years, the ratio might actually continue to decrease and reach healthy levels.
The ratio between long term debt and earnings looks more attractive with a median of 2.54 and a clear downward trend: From a 3.10 ratio in 2021 to a value of 2.12 in 2024. That means that the company could pay back all its long term debt with only 2 years worth of earnings, and this is what we are looking for in a great business to invest in.

Verdict
A small but mighty car manufacturer – financially healthy and growing.
Using our custom scoring model for business health, Ferrari achieves 14 out of 19 total points, giving it a score of 74%. From the 92 companies that we are currently monitoring, 19 achieve a higher score. Ferrari shines with great and stable margins that put the company way ahead of the other European car manufacturers. In addition, it boasts consistent and growing earnings and a high return on equity. It has relatively high capital expenditures but they are clearly decreasing relative to the growing earnings and we find similar positive trends for debt levels.
The full table with performance metrics and scores is shown below.
| Performance indicator | Metric | Value | Score |
| Gross margin | Median | 50.0% | 2 |
| Gross margin | Coefficient of variation | 2.7% | 1 |
| SG&A expense rate | Median | 16.3% | 2 |
| Net income | Growth | 21.1% | 1 |
| Net income | Consistency | yes | 1 |
| Net margin | Median | 20.2% | 2 |
| Long term debt to earnings ratio | Median | 2.54 | 1 |
| Total liabilities to equity ratio | Median | 1.84 | 0 |
| Retained earnings | Growth | 16.0% | 1 |
| Share buybacks | Existence | yes | 1 |
| Return on equity | Median | 39.3% | 2 |
| CAPEX to earnings | Median | -77.8% | 0 |
| Total | 14/19 |
Disclaimer: The content on this page is for informational and educational purposes only and does not constitute financial, investment, or trading advice. All opinions expressed are solely those of the author. There are risks associated with investing in securities, including the loss of invested capital. Past performance is not a guarantee or predictor of future results. The author is not responsible for any losses incurred as a result of the information provided.