In this article we are going to analyze the financial health of German chemicals company BASF using our custom scoring model for business health to assess whether it presents an appealing opportunity for blue chip value investors that are looking to buy great businesses at great prices.
BASF SE is one of the world’s leading chemical companies, headquartered in Ludwigshafen, Germany. Founded in 1865, BASF operates globally with a broad portfolio that includes chemicals, materials, industrial solutions, surface technologies, nutrition & care, and agricultural solutions. The company serves a wide range of industries, from automotive and construction to agriculture and consumer goods. Known for its innovation and sustainability efforts, BASF is a key player in the global shift toward greener technologies.
Margins: 2 of 5 possible points
BASF had a median gross margin of 25% in the last four years with very little variation – it only ranged from a low of 24.1% to a high of 26.2%. That puts it toward the low end of the acceptable range for our investments: We are looking for gross margins larger than 20% and ideally above 40%. And while the gross margin is acceptable, the net margin looks less attractive. With a median of 1.2% the company keeps barely any profit from its operations.
In fact, 2021 was the last year with a somewhat decent net margin of 7.2%. In the years that followed it was hovering around zero after turning negative in 2022. 2022 was a particularly troubling year due to the negative earnings contribution of Wintershall Dea AG. And in the years to follow we can observe reduced revenue in combination with increased operating costs, which when combined put the bottom line under stress.

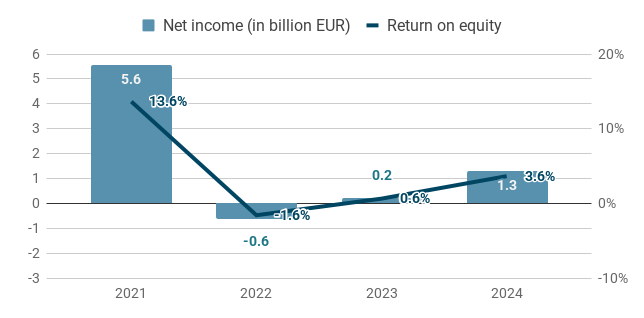
Earnings: 0 of 4 possible points
For a company we want to invest in we are looking for two things when we study earnings: growth and consistency. Unfortunately, BASF shows neither of the two. Net income decreased from €5.6bn in 2021 to €1.3bn in 2024 – a decline of 77%. And it has been even lower in the years in between. Return on equity shows the same trend. That implies that any changes in equity must have been smaller than the drastic changes in earnings.
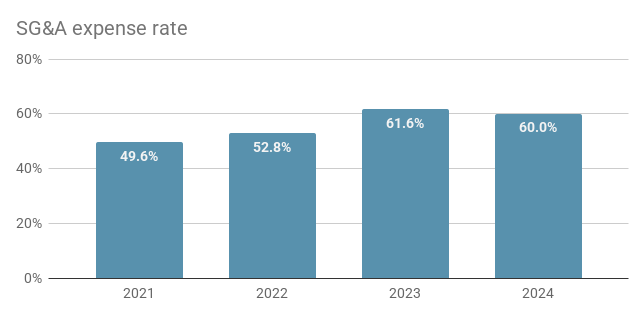
Expenses: 1 of 4 possible points
To assess expenses we are going to look at two ratios: SG&A expenses as a percentage of gross profit and capital expenditures as a percentage of earnings. BASF had absolute SG&A expenses between €9.8bn and €11.1bn during the last four years. The median SG&A expense rate was 56%, which isn’t great but acceptable. Unfortunately, the trend isn’t looking favorable: Absolute expenses have been growing over the years and in combination with declining gross profit the expense rate has also grown from 50% in 2021 to 60% in 2024.
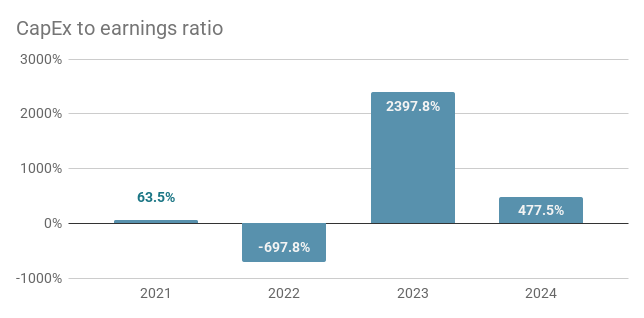
The capital expenditures look even worse. The median over the four year period is 271%. Taking into consideration that 2022 was a year with net losses, and thus there is no useful value for the capital expenditures to earnings ratio, the median of the remaining three data points is 478%. However, both values are far above what we are looking for in an investment, i.e. a ratio below 50% and ideally below 25%. To add to the dire situation, the absolute expenditures are actually increasing over time: From €3.5bn in 2021 to €6.2bn in 2024 – a 75% increase despite a drastic reduction in earnings (-77%) over the same period.
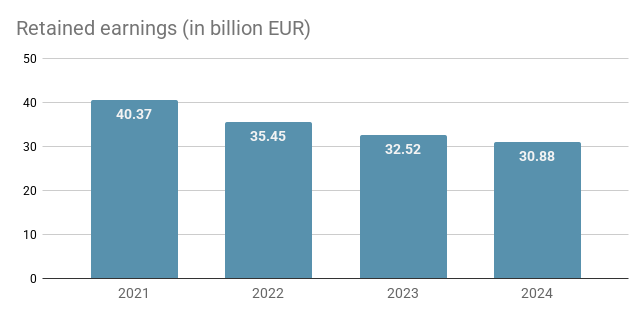
Debt and Equity: 1 of 6 possible points
The first of the three metrics we look at is retained earnings growth. Unfortunately, the weak performance we have seen in the previous sections continues here. Retained earnings have been declining every year, from €40bn in 2021 to €31bn in 2024. That is an average decline of 9% per year.
The other two metrics are ratios again. First, we are going to look at the ratio between long term debt and earnings. The median over the past four years is 8.61. That is far above what we would like to see in a company that we want to invest in. Ideally, we are looking for a value below 2 and it should not exceed 4. Because that would mean a company could pay back all of its long term debt with less than four years of earnings. Given that BASF is that far away from good performance, it doesn’t even matter much that we observe extreme volatility over the past four years with values ranging from -24 to 76. This of course is driven by the strong differences in annual earnings and less by the slow but steady incline in long term debt – from €13.8bn in 2021 to €19.1bn in 2024.
Eventually, the total liabilities to equity ratio presents itself as somewhat of a silver lining: A respectable median of 1.13 and low variation throughout the years.

Verdict
A troubled business that shouldn’t find its way into a portfolio of great blue chip stocks.
Using our custom scoring model for business health, BASF achieves 4 out of 19 total points, giving it a score of 21%. This is the lowest score that we have observed in the 90 companies that we are currently monitoring. It clearly indicates a company that is in trouble. Of the past four years, 2021 was clearly the one with the best performance and, yet even in that year the company would fall short of our expectations for a great business to invest in on many metrics:
- 25% gross margin (ideally we are looking for 40% or higher)
- 7% net margin (10% is acceptable performance, 20% or more would be desirable)
- 50% SG&A expense rate (lower than 70% is satisfactory, below 30% ideal)
- Long term debt to earnings ratio of 2.5 (below 4 is acceptable, below 2 is preferable)
- A return on equity of 14% ( we would like to see at least 15% and ideally more than 25%)
- Capital expenditures of 64% earnings (we are looking for a value at least smaller than 50% and ideally less than 25%)
Consequently, BASF is unconvincing in all of the four categories of our financial analysis: margins, earnings, expenses, and debt.
The full table with performance metrics and scores is shown below.
| Performance indicator | Metric | Value | Score |
| Gross margin | Median | 24.7% | 1 |
| Gross margin | Coefficient of variation | 3.8% | 1 |
| SG&A expense rate | Median | 56.4% | 1 |
| Net income | Growth | -73.9% | 0 |
| Net income | Consistency | no | 0 |
| Net margin | Median | 1.2% | 0 |
| Long term debt to earnings ratio | Median | 8.61 | 0 |
| Total liabilities to equity ratio | Median | 1.13 | 1 |
| Retained earnings | Growth | -9.0% | 0 |
| Share buybacks | Existence | no | 0 |
| Return on equity | Median | 2.1% | 0 |
| CAPEX to earnings | Median | -270.5% | 0 |
| Total | 4/19 |
Disclaimer: The content on this page is for informational and educational purposes only and does not constitute financial, investment, or trading advice. All opinions expressed are solely those of the author. There are risks associated with investing in securities, including the loss of invested capital. Past performance is not a guarantee or predictor of future results. The author is not responsible for any losses incurred as a result of the information provided.