Adobe Inc. (NASDAQ:ADBE), founded in 1982 by John Warnock and Charles Geschke, is a leading American multinational software company headquartered in San Jose, California with more than 30,000 employees worldwide. The company revolutionized desktop publishing with the introduction of PostScript, a page description language that became an industry standard. Adobe’s flagship product, Creative Cloud, is a subscription-based service that provides access to a comprehensive suite of creative applications, including Photoshop, Illustrator, Premiere Pro, and Firefly catering to professionals in photography, design, video editing, and more. The company also offers Document Cloud, featuring Acrobat and PDF services, facilitating seamless document creation and management. In recent years, Adobe has expanded into digital marketing and customer experience management through its Experience Cloud, offering solutions for analytics, advertising, and commerce.
tl;dr A strong technology business with healthy financials and good competitive strength.
Financial analysis of Adobe shows great and stable gross and net margins, as well as consistent and growing net income and retained earnings. We observe low debt and capital expenditures and a good return on equity.
Looking at competitive strength, we find that Adobe performs better than its closest competitors in 80% of the metrics we use for comparison. It has better gross margins and capital expenditures than its top 3 competitors and is on par or better with the average performance of its competitors for net margin and return on equity.
Financial analysis
Using our custom scoring model, Adobe achieves 18 out of 19 total points, giving it a score of 95%. From the 79 companies that we are currently monitoring, only one achieves a higher score. It achieves full scores for margins, earnings, and debt and equity. Moderately high SG&A expenses prevent it from achieving a perfect score. All metrics are very stable with the positive exceptions of reduced capital expenditures and a recent increase in return on equity. The full table with performance metrics and scores is shown below.
| Performance indicator | Metric | Value | Score |
| Gross margin | Median | 88.0% | 2/2 |
| Gross margin | Coefficient of variation | 0.7% | 1/1 |
| SG&A expense rate | Median | 39.2% | 1/2 |
| Net income | Growth | 5.6% | 1/1 |
| Net income | Consistency | yes | 1/1 |
| Net margin | Median | 27.8% | 2/2 |
| Long term debt to earnings ratio | Median | 0.75 | 2/2 |
| Total liabilities to equity ratio | Median | 0.33 | 2/2 |
| Retained earnings | Growth | 15.7% | 1/1 |
| Share buybacks | Existence | yes | 1/1 |
| Return on equity | Median | 33.4% | 2/2 |
| CAPEX to earnings | Median | 6.9% | 2/2 |
| Total | 18/19 |
Margins (5/5)
Adobe enjoys a very high and stable gross margin. The median of the last 4 years has been an outstanding 88% with barely any variation from year to year. The net margin is also high with a median of 28%. However, here we observe a slight decrease from a high of 31% in 2021 to 26% in 2024. The small drop in 2024 compared to 2023 can be attributed to higher operating expenses, in particular the $1bn acquisition termination fee for the unsuccessful acquisition of Figma.

Earnings (4/4)
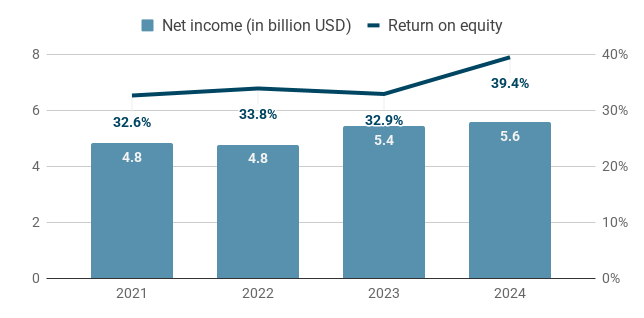
Adobe shows consistent earnings of about $5bn each year. Earnings are growing at 6% per year on average. Earnings growth was particularly strong in 2023 and 2024, reaching $5.6bn of net earnings, which is 17% higher than the $4.8bn earned in 2021. The return on equity is also quite high with a median of 33% over the last four years. In 2024 it jumped to 39%, driven by the growth in earnings and increased share buybacks: In 2024 Adobe reduced the number of ordinary shares by 16,000 which increased its number of treasury shares by 10% and reduced stockholder’s equity by 15%.

Expenses (3/4)
To evaluate expenses we are going to look at two ratios: SG&A expenses as a percentage of gross profit and capital expenditures as a percentage of earnings. Absolute SG&A expenses have been increasing over the past 4 years from $5.4bn in 2021 to $7.3bn in 2024. However, this has been in lockstep with top line growth and as a result, the SG&A expense rate has been rather stable, fluctuating only very little around a median of 39%.

The capital expenditures to earnings ratio has a median of 7% over the last 4 years – an exceptionally good value. We also see a decline from a peak of 9% in 2022 to a mere 3% in 2024. This is driven by a 60% reduction in capital expenditures in the last two years despite growing revenue and earnings.

Debt and Equity (6/6)
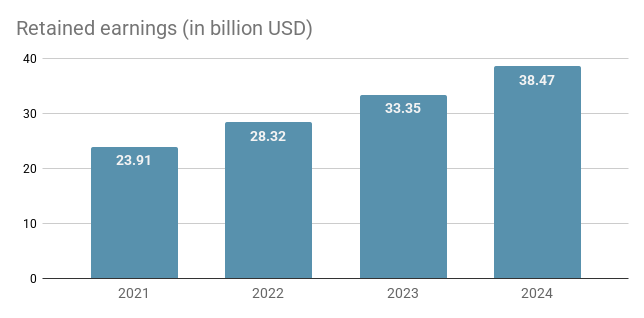
On the equity side we can observe a steady growth of retained earnings: From $24bn in 2021 to $38bn in 2024. That is an absolute increase of 61% and an equivalent growth of 16% per year.

When we look at the company’s debt, we find that the total liabilities to equity ratio remains rather stable throughout the years and hovers around a median value of 0.33 – a very good value. Long term debt to earnings has a slightly higher median of 0.75 and shows a small uptick after a series of declines. Both values are excellent results: For the total liabilities to equity ratio a value below 0.8 is considered a great performance and for the long term debt to earnings ratio a value below 4 is desirable because it means a company could pay back its debt with less than four years of earnings. Adobe undercuts these reference points by a large margin for both metrics.

Competitive Strength
Competitors
Using the annual report, Yahoo Finance, Google and ChatGPT, we identify the following publicly traded companies as relevant competitors of Adobe (sorted by market capitalization in US Dollar from high to low):
- Apple ($3,670bn): A global major player in consumer electronics that competes with Adobe in professional creative software tools.
- Microsoft ($3,040bn): A multinational technology conglomerate that competes with Adobe in the areas generative AI and cloud services.
- Alphabet ($2,270bn): The parent company of Google that competes with Adobe in AI-powered creativity, cloud-based design tools, digital marketing, and document management.
- Oracle ($487bn): An American computer technology company that competes with Adobe in digital marketing, customer experience, data analytics, and cloud services.
- Salesforce ($312bn): An American cloud-based software company that competes with Adobe in digital marketing, customer relationship management and data analytics.
- Autodesk ($65bn): An American multinational software corporation that offers software for digital design, 3D modeling, and animation.
- Hubspot ($42bn): An American developer of software products that competes with Adobe in software for digital marketing, customer experience, and customer data management.
- Docusign ($18bn): An American software company that competes with Adobe in the electronic signature, document management, and digital workflow automation space.
Overall comparison
When we inspect the 4 metrics we use to gauge competitive strength, we find that Adobe outperforms the competition in 24 out of 30 comparisons (4 metrics times 8 competitors minus two unusable results due to negative earnings), i.e. it performs better in 80% of the cases – a very strong result. Looking at the performance of the top 3 competitors for each metric, we find that Adobe still beats this strong benchmark for gross margin (+4%) and capital expenditures to earnings ratio (-11%), and it trails net margin by 1%. Return on equity is the only metric where the top performing competitors have a huge lead on Adobe.
| Metric | Adobe | Median of competitors | Average of top 3 competitors |
| Gross margin | 88% | 75% | 84% |
| Net margin | 28% | 18% | 29% |
| Return on equity | 33% | 34% | 139% |
| CapEx to earnings ratio | 7% | 35% | 18% |
To get a holistic picture that incorporates each company’s performance on all four metrics, we can rank them individually on each metric and compute the average rank per company.
Here we find that Adobe ranks first on capital expenditures to earnings ratio and second on gross and net margin. Return on equity is the only metric with mediocre performance. In total, that still gives it the best average rank, especially because the four next best ranked competitors – even though they rank first or second on one or more metrics – show worse performance in at least one other metric (Autodesk on net margin, Microsoft and Apple on gross margin and Oracle on capital expenditures to earnings ratio).
| Company | Gross margin | Net margin | Return on equity | CAPEX to earnings | Average rank |
| Adobe | 2 | 2 | 5 | 1 | 2.5 |
| Autodesk | 1 | 6 | 3 | 2 | 3.0 |
| Microsoft | 7 | 1 | 4 | 5 | 4.3 |
| Apple | 9 | 4 | 2 | 3 | 4.5 |
| Oracle | 5 | 5 | 1 | 7 | 4.5 |
| Alphabet | 8 | 3 | 6 | 6 | 5.8 |
| Salesforce | 6 | 7 | 7 | 4 | 6.0 |
| Hubspot | 3 | 9 | 8 | 8.5 | 7.1 |
| Docusign | 4 | 8 | 9 | 8.5 | 7.4 |
Let’s dive into the details.
Margins
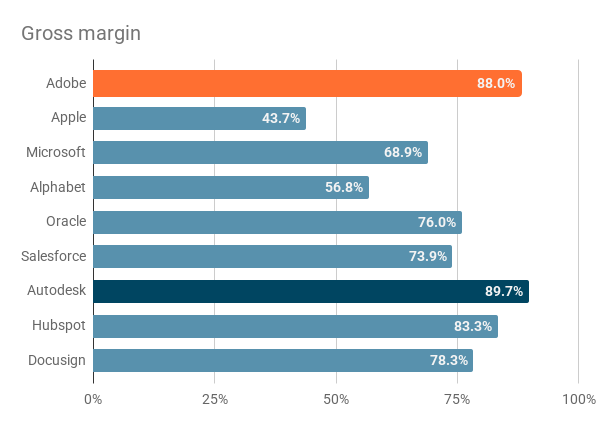
More than half of the companies exhibit gross margins of 75% or more, thus the industry as a whole is enjoying rather high margins. Only one competitor (Autodesk) has a gross margin slightly higher than Adobe. Those two leaders are then followed by a group of companies who are primarily or exclusively offering software products with gross margins in the range between 74% and 83%. At the end of the ranking we find the three biggest competitors that are most diversified and have varying amounts of hardware products in their portfolio. These products naturally have lower gross margins due to a larger share of variable production costs for physical resources and manual labor.

The median net margin of these 9 companies is 18%. Microsoft is the sole strong leader with 36%. Adobe is in the follower group together with Apple and Alphabet with net margins between 25% and 27% – still well above the median. At the end of the list, we find Hubspot and Docusign with negative net margins: These two companies have only earned a net profit in the last year and had large losses in the three preceding years. Overall, we also see a decline in net margin with company size, i.e. the smaller companies (by market capitalization) have lower net margins. In terms of market capitalization, Adobe ($195bn) would sit between Salesforce and Autodesk. That makes the net margin of 28% even more impressive.

Return on equity and CapEx to earnings ratio
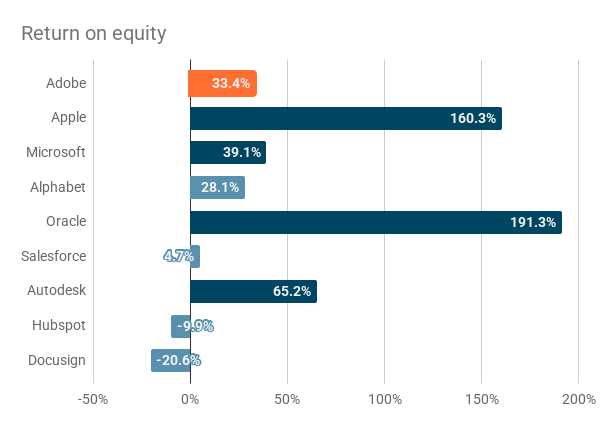
Return on equity shows by far the largest performance variation among the analyzed companies and the most extreme results on both ends. Apple and Oracle are clearly leading with 160% and 191%, respectively. In the case of Apple that is the result of a long series of aggressive share buy-backs to reduce equity and Oracle had low – and at times negative – levels of equity relative to their revenue, which makes the return on equity metric skyrocket but less meaningful. Adobe shows average performance, ranking behind Microsoft and Autodesk but ahead of Alphabet. Hubspot and Docusign show a negative return on equity due to the losses discussed in the last section.

Due to negative earnings for most of the analyzed time period we can’t compute a meaningful capital expenditures to earnings ratio for the two smallest competitors Hubspot and Docusign. The median of the remaining seven companies is 35% and they break down into two groups:
- The first group – with better performance – contains Autodesk, Adobe and Apple with values between 7% and 11%, which are outstanding. Adobe has only a tiny lead on Autodesk but a large margin on most competitors.
- The second group with the remaining four companies has a ratio of 30% or more, which is not bad but also not great either.

Disclaimer: The content on this page is for informational and educational purposes only and does not constitute financial, investment, or trading advice. All opinions expressed are solely those of the author. There are risks associated with investing in securities, including the loss of invested capital. Past performance is not a guarantee or predictor of future results. The author is not responsible for any losses incurred as a result of the information provided.