In its own words, “Kering is a global Luxury group composed of iconic and dynamic Houses in Fashion, Leather Goods and Jewelry.” It is a French-based multinational corporation with close to 50,000 employees that is present across the globe with its well known brands, such as Gucci, Balenciaga or Yves Saint Laurent. Founded as a timber trading company in the 1960s and transforming into a retail conglomerate in the 1990s, it has transformed itself once more into the Luxury group that it is today by divestment and acquisition. That process started with obtaining a controlling stake in Gucci in 1999, the brand that until today represents the largest share of revenue (approximately 50%). In recent years, Kering has started building and expanding its position in eyewear and beauty while remaining solely dedicated to the luxury market. For value investors it is an interesting opportunity to gain a foothold in the luxury market.
tl;dr A solid business that is strongly undervalued, but contains some uncertainties
Financial analysis of Kering shows a good gross margin (74%) and earnings growth (11% p.a.) but also high overhead expenses and, as a consequence, a comparably low net margin (16%). A significant amount of strategic investments – especially in real estate – has increased capital expenditures and debt.
Looking at competitive strength, we find that Kering is doing better than the median competitor, but is not leading the field (it lags behind the most performant competitor Hermès).
From a valuation perspective the stock appears to be strongly undervalued. Using a discounted cash flow model, we estimate the intrinsic value of the stock to be €395 per share. With the stock currently trading at €255 it appears to be undervalued by 36%. Relative valuation using multiples confirms that finding: With a P/E ratio of 15 it is trading 25% lower than its closest competitors.
Financial analysis
Using our custom scoring model, Kering achieves 14 out of 19 total points, giving it a score of 74%. From the 76 companies that we are currently monitoring, 16 achieve a higher score. It scores well on gross margin and earnings growth, but net margin is comparably low due to substantial overhead expenses. Overall, we see good trends and levels in managing capital expenditures and debt, with the exception that 2023 saw a sudden surge in both due to increased acquisition activity. These are strategic investments devised to fuel future growth. The full table with performance metrics and scores is shown below.
| Performance indicator | Metric | Value | Score |
| Gross margin | Median | 74.1% | 2/2 |
| Gross margin | Coefficient of variation | 1.8% | 1/1 |
| SG&A expense rate | Median | 56.9% | 1/2 |
| Net income | Growth | 10.8% | 1/1 |
| Net income | Consistency | yes | 1/1 |
| Net margin | Median | 16.2% | 1/2 |
| Long term debt to earnings ratio | Median | 1.43 | 2/2 |
| Total liabilities to equity ratio | Median | 1.34 | 1/2 |
| Retained earnings | Growth | 30.2% | 1/1 |
| Share buybacks | Existence | yes | 1/1 |
| Return on equity | Median | 21.2% | 1/2 |
| CAPEX to earnings | Median | -36.4% | 1/2 |
| Total | 14/19 |
Margins (4/5)
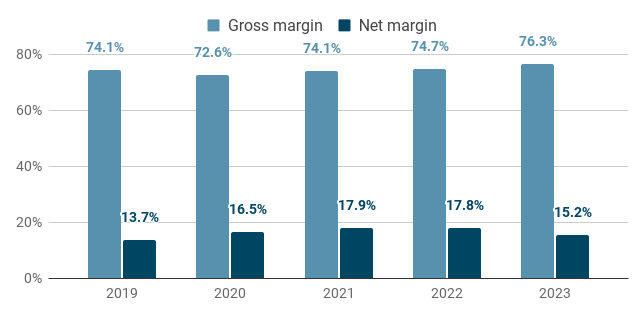
Kering enjoys a very high and stable gross margin. The median of the last five years was 74% and fluctuated very little, albeit the global pandemic that affected many businesses, and especially those selling non-essential items. With a median of 16% over the same period, the net margin is significantly lower, indicating a substantial amount of overhead expenses.
Earnings (3/4)
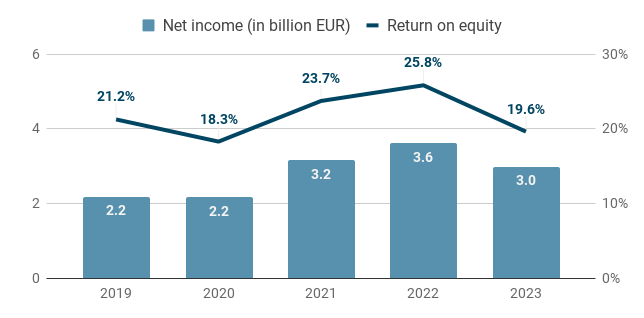
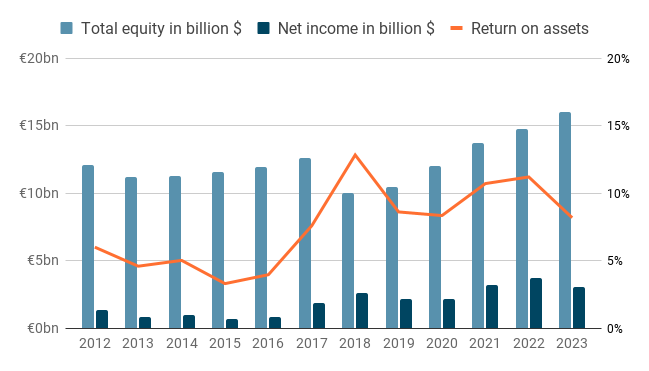
Kering’s net income has grown considerably by 11% per year for the past years on average, but has seen a decline in the most recent year. However, at €3bn this is still 36% higher compared to 2019. Furthermore, earnings have been consistent, i.e. there were no years with losses. Return on equity is moderately high with a median of 21% over the past five years.
Expenses (2/4)
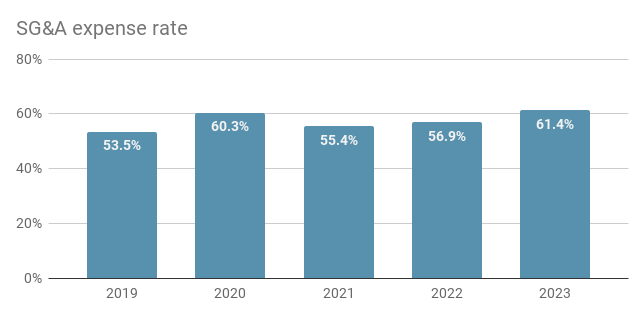
For expenses we are going to look at two ratios: SG&A expenses as a percentage of gross profit and capital expenditures as a percentage of earnings. The median SG&A expense rate of the past 5 years is 57% and looking at the annual data we can see a slight upward trend. Gross profit itself has been growing during that time frame from €11.8bn in 2019 to €14.9bn in 2023 (+26% total or 6% per year), thus the expenses must have grown at an even faster pace: From €6.3bn in 2019 to €9.2bn in 2023, which is a 46% increase (10% per year) and means that overhead expenses grew at almost twice the rate of gross profit.
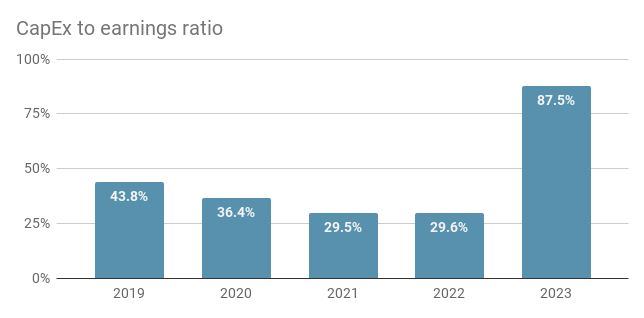
The median capital expenditures of the past 5 years have been 36% of earnings – a good value. When we look at the annual data, we see that the capital expenditures to earnings ratio has actually been declining – a good sign. This has been the result of keeping capital expenditures constant while growing earnings. In contrast, 2023 saw a huge jump in capital expenditures, driven by increased investments in real estate as laid out in the Kering 2023 financial report (p.24):
“Operating investments amounted to €2,611 million in 2023, an increase of €1,540 million or 144% relative to 2022. Excluding the acquisition of strategic real-estate assets in Paris, they totaled €1,230 million, representing 6.3% of revenue.” When we exclude the strategic acquisition, the CapEx to earnings ratio for 2023 is 41% – closer to the 5 year median.
Debt and Equity (5/6)
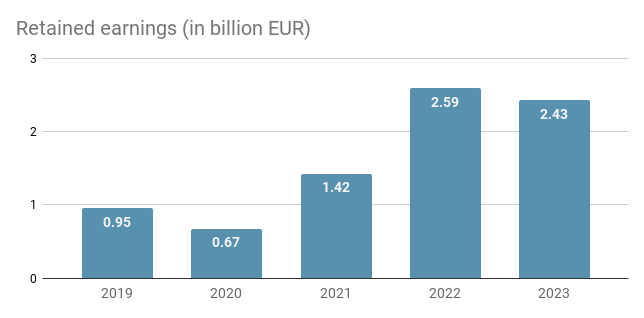
On the equity side we find that retained earnings have grown a lot in recent years – by about 30% per year on average. However, that growth wasn’t smooth – in the annual performance we can see a dip in 2020 and a strong jump in 2022. The total number of shares has reduced from 126k in 2019 to 123k in 2023 – a reduction of just under 1% per year.
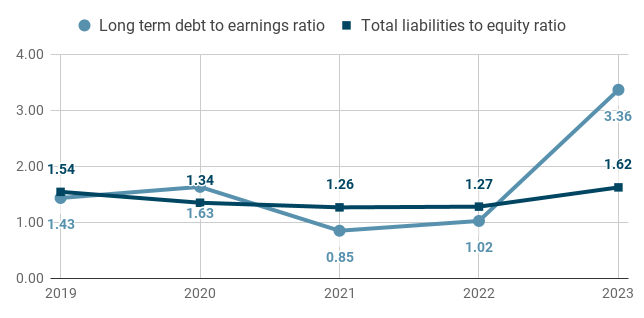
When we look at the company’s debt, we find that the total liabilities to equity ratio remains rather constant throughout the years and hovers around a median value of 1.3, which is good but not great. Long term debt to earnings ratio has been moving around a center value of 1.2 most of the years but saw a sudden surge in 2023 – from 1 to 3.4. This is caused by the issuance of bonds to finance current acquisitions with a total value of approximately €6.3bn (p.16 in the financial report linked above). But even that higher level of debt could be repaid with less than 4 years worth of earnings – which is a desirable level.
Competitive Strength
Competitors
Using the annual report, Yahoo Finance, Google and ChatGPT, we identify the following publicly traded companies as relevant competitors of Kering (sorted by market cap in US Dollar from high to low):
- LVMH ($351bn): A French multinational luxury goods conglomerate that emerged from the merger of Louis Vuitton (fashion) and Moët Hennesy (champagne & cognac).
- Hermès ($230bn): A French producer of luxury goods, especially leather goods, including the famous handbags.
- Richemont ($91bn): A Swiss luxury goods holding company with premium brands in the jewelry (Cartier), watches (A. Lange & Söhne), and pens (Montblanc) markets.
- Prada ($20bn): An Italian luxury fashion house that produces its own high-end luxury items and licenses their brand to other manufacturers.
- Swatch ($11bn): A Swiss manufacturer of watches and jewelry and the largest watch company in the world.
- Tapestry ($9bn): An American multinational fashion company specializing in luxury accessories and branded lifestyle products.
- Brunello Cucinelli ($6bn): An Italian luxury fashion brand that sells clothing, accessories and lifestyle products.
- Capri ($4bn): A multinational fashion holding company that designs, produces and distributes apparel, footwear and accessories under brands such as Versace, Michael Kors and Jimmy Choo.
- Burberry ($4bn): A British luxury fashion house that provides ready-to-wear garments, most notably the famous trench coats.
Overall comparison
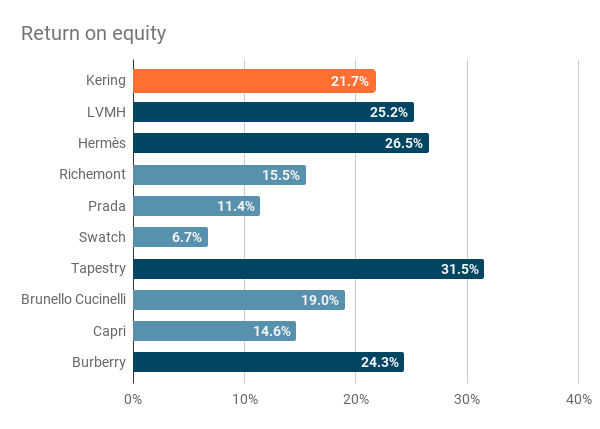
When we inspect the 4 metrics we use to gauge competitive strength, we find that Kering outperforms the competition in 24 out of 36 comparisons (4 metrics times 9 competitors), i.e. it performs better in 67% of the cases – a solid result. On the one hand, the company performs better than the median competitor, with margins that are about 4% higher and also 10% lower capital expenditures relative to earnings. But on the other hand, we can always find at least one competitor that outperforms it on any given metric, e.g. Prada (gross margin), Hermès (net margin and CapEx to earnings) or Tapestry (Return on investment).
| Metric | Kering | Median of competitors | Average of top 3 competitors |
| Gross margin | 74.4% | 70.2% | 75.1% |
| Net margin | 17.1% | 13.4% | 20.8% |
| Return on equity | 21.7% | 19.0% | 27.8% |
| CapEx to earnings ratio | 33.0% | 43.8% | 27.5% |
To get a holistic picture that incorporates each company’s performance on all four metrics, we can rank them individually on each metric and compute the average rank per company. Here we find that Kering achieves a shared second rank together with Tapestry, behind a strong sole leader – Hermès – that achieves top ranks for all metrics except gross margin. Kering benefits from having “good, but not great” performance across all metrics. This is in contrast to companies like Prada or Swatch: They are leading in gross margin but perform poorly on the other metrics.
| Company | Gross margin | Net margin | Return on equity | CAPEX to earnings | Average rank |
| Hermès | 4 | 1 | 2 | 1 | 2.0 |
| Tapestry | 6 | 6 | 1 | 2 | 3.8 |
| Kering | 3 | 3 | 5 | 4 | 3.8 |
| LVMH | 7 | 2 | 3 | 6 | 4.5 |
| Burberry | 5 | 5 | 4 | 5 | 4.8 |
| Richemont | 8 | 4 | 7 | 3 | 5.5 |
| Swatch | 2 | 7 | 10 | 8 | 6.8 |
| Prada | 1 | 8 | 9 | 9 | 6.8 |
| Capri | 9 | 10 | 8 | 7 | 8.5 |
| Brunello Cucinelli | 10 | 9 | 6 | 10 | 8.8 |
Margins
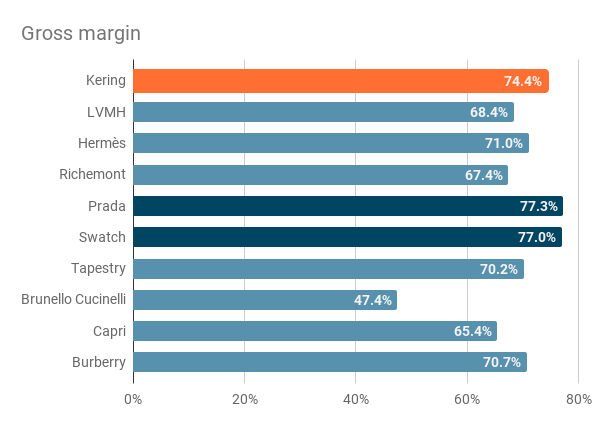
All but one company achieved a gross margin of more than 65% and the top two companies even managed to raise that to 77%. That means that the industry as a whole is enjoying large margins, which is no surprise since we are looking at luxury products where high prices are an intentional part of branding and positioning to allow the affluent customer to signal status and differentiate herself. With a gross margin of 74% Kering earned itself a spot in the top 3 – together with Prada and Swatch.
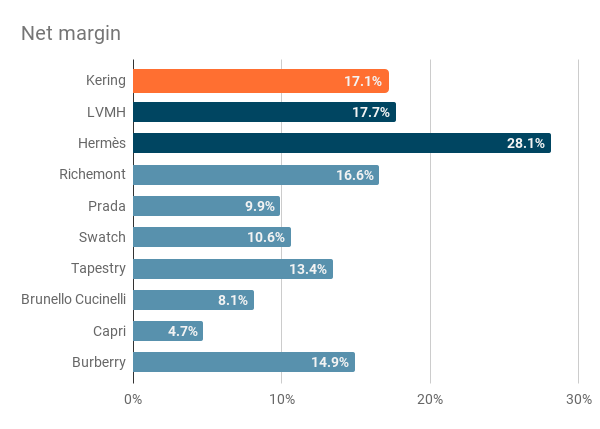
When we look at net margin, we find three clusters:
- First, there is Hermès with a phenomenal 28% net margin, which is 60% higher than the next best competitor (LVMH at 18%)
- Next, we find a handful of companies – including Kering – with net margins in the mid to high teens.
- Finally, the remaining companies mostly post net margins in the single digits.
One trend that we can observe here is that scale (as indicated by market cap) seems to provide an advantage to obtain higher net margins in this industry: The four companies with highest net margin are also the four largest ones. The only exception is Burberry, which is the smallest company by market cap in our group, but ranks fifth for net margin.
Return on equity and CapEx to earnings ratio
The median return on equity of the analyzed competitors is 19%. Kering performs just above that with 22%, but is closer to the median than to the three top performers that exhibit an average return on equity of 28%. Consequently, it only ranks fifth out of 10 companies. That means that quite a few competitors have found better, more profitable ways to put shareholder’s money to use and generate earnings.
When we look at the capital expenditures to earnings ratio, we find a division of the companies into three groups again:
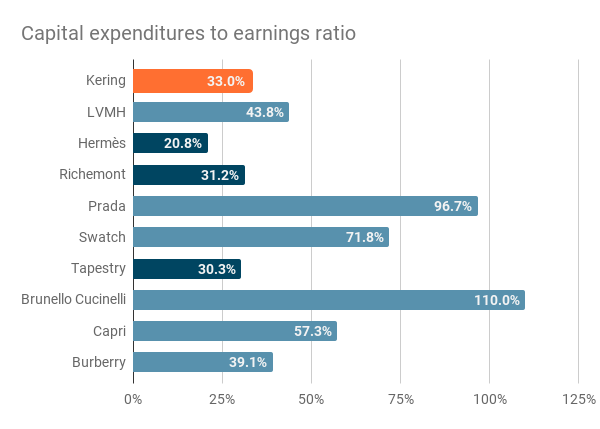
- On the top end of the spectrum we find Hermès: With only 21% of earnings appropriated to capital expenditures it has the best performance and a substantial lead to the next best performer (Tapestry at 30%)
- At the opposite end we find four companies (Brunello Cucinelli, Prada, Swatch and Capri) that spend more than 50% of their earnings on capital expenditures. All of them experienced years with net losses, which drives up the ratio.
- Finally, we have a group of companies with moderate spending relative to earnings that includes Kering, LVMH, Richemont, Tapestry and Burberry. Their capital expenditures amount to 31% to 44% of earnings. Within that group, Kering finds itself on the favorable end of the spectrum with a CapEx to earnings ratio of 33% – a decent performance and significantly below the median of the competitors (44%).
Intrinsic value
The average cash flow of the last 5 years, including the trailing twelve months was €2.48bn. It was significantly higher in 2021 and 2022 but has now returned to pre-pandemic levels. The ratio between market capitalization and free cash flow has seen a lot of fluctuation around a median of 25.

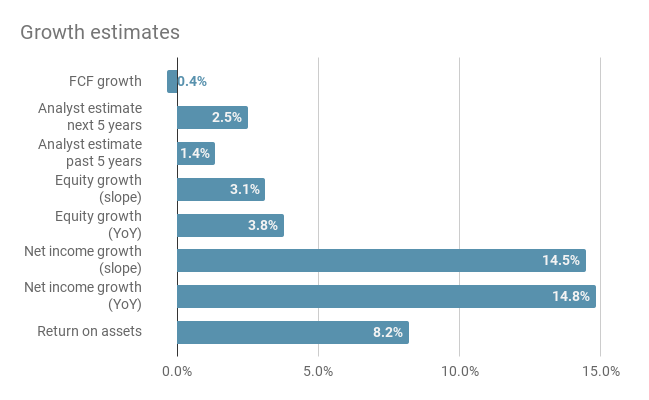
Free cash flow growth for the period 2018 to today was -0.4% and analyst estimates for past and future growth are both close to 2%. Over the majority of the past 10 years, equity was growing consistently in the single digit range with a median of just under 4%. Net income shows a much more pronounced positive trend of 15% growth per year over the same period. When we look at return on assets, we see that there are two distinct periods: Prior to 2018 it was in the single digit range, averaging 5% per year. For the period 2018 to today it has doubled, averaging 10% per year. Consequently, the median over the entire period is 8%.
The average of these growth estimates is 6%, which is clearly pulled upwards by the high growth rate of net income. While that estimate could be justified by the stronger growth of net income and the higher return on assets in recent years, we should not overlook the fact that both, free cash flow and net income have been decreasing for the most recent periods. Therefore, the median of the growth rates provides a more conservative estimate of 3.5%.
To summarize, for our intrinsic valuation we have:
- A current free cash flow of €2.48bn
- A growth rate of 3.5%
- A time frame of 10 years
- A terminal value multiple of 25 (based on the idea of buying and then selling the whole business for its market capitalization)
- A discount rate of 12%, which reflects our desired rate of return for the excess risk we are taking on by investing into a single stock as opposed to buying a bond or a market-wide passive index fund.
Plugging all these values into a standard discounted cash flow model, we obtain an intrinsic value of €48bn for the company, which is equivalent to €395 per share. Shares of Kering are currently trading at €255, thus the company seems strongly undervalued (-36%) according to our model. If we were to take the more optimistic stance of 6% growth, the intrinsic value would increase to €58bn / €471 per share, which would make the company appear even more undervalued (-46%).
Relative valuation using multiples
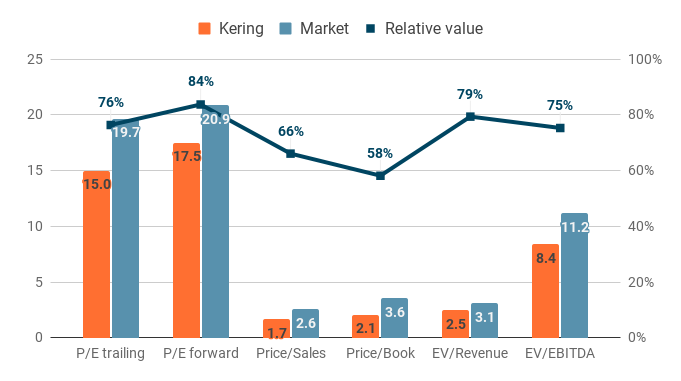
Kering is currently trading at a trailing P/E ratio of 15.0. The median of the relevant market, i.e. the competitors, is trading at a ratio of 19.7, thus according to the P/E ratio, Kering stock appears to be undervalued by 24%. The forward P/E ratio is higher than the trailing P/E ratio, implying an optimistic outlook that is also echoed by the market:
- Kering: 15.0 trailing vs 17.5 forward (+2.5)
- Market: 19.7 trailing vs 20.9 forward (+1.2)
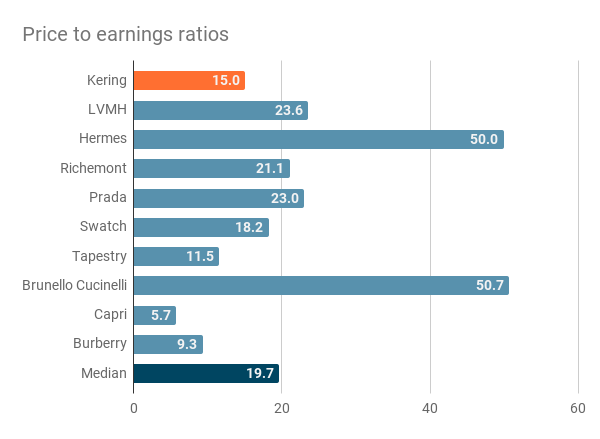
Multiplying Kering’s most recent earnings per share of €24.38 with the median trailing P/E ratio of the market of 19.7 gives us an estimate of the share price of €479 for the scenario that the stock would “regress to the mean”. That would be a significant growth from the current share price of €254 (+89%).
However, the outlook for future earnings is less optimistic with earnings per share expected to decline to €14.21 for 2024 and €17.12 for 2025. Using these estimates and the trailing as well as the forward P/E ratios of the market and averaging the results gives us an expected share price of €318. This is a significantly lower outlook, but still constitutes a 25% upside to the current share price of €254.
The expected sales for 2024 are €17.7bn and €19.1bn for 2025, respectively, after sales of €19.6bn in 2023. Applying the price to sales ratio of the market (2.56) to these expectations would give us a stock price estimate of €384 for the scenario of regressing to the mean.
When we look across different multiples, we find that Kering is undervalued relative to its peers on all metrics. Price/Sales (66%) and Price/Book (58%) exhibit the lowest relative value while forward P/E ratio (84%) and EV/Revenue (79%) mark the top end. Using the median of all relative valuation measures, we find that Kering appears to be undervalued, having a value relative to its peers of 76% across all multiples. This reinforces the findings of intrinsic valuation, where we found the stock to be currently trading at 64% of its intrinsic value.
Disclaimer: The content on this page is for informational and educational purposes only and does not constitute financial, investment, or trading advice. All opinions expressed are solely those of the author. There are risks associated with investing in securities, including the loss of invested capital. Past performance is not a guarantee or predictor of future results. The author is not responsible for any losses incurred as a result of the information provided.