Company profile
The Coca Cola Company (NYSE: KO) is a global leader in the beverage industry, renowned for its flagship product, Coca Cola. It manufactures, markets, and sells beverage concentrates, syrups, and finished beverages to authorized bottling partners. Founded in 1892, the company boasts a diverse portfolio of about 200 master brands, including Diet Coke, Fanta, and Sprite, with a presence in almost all beverage categories. The Coca Cola Company operates in more than 200 countries and generated an annual revenue of $46bn last year with their products being sold in more than 30 million retail outlets.
Together with its bottling partners, the company employs more than 700,000 people worldwide. For value investors, Coca Cola represents a stable, dividend-paying stock with a strong brand presence and consistent cash flow, making it a staple in long-term investment portfolios.
tl;dr: A strong but overvalued business
Financial analysis of the Coca Cola Company shows that it delivers strong and consistent business results. The highlights are:
- High and stable margins: 60% gross margin and 24% net margin
- Consistent net income ($10.7bn last year) that is growing (6% growth)
- High return on equity (51%)
- Low capital expenditures (16%)
Looking at competitive strength, we find that it performs better than its closest competitors in 82% of the cases we use for comparison. There is not a single competitor that beats the Coca Cola Company in more than 1 metric and only 5 out of 11 companies accomplish that feat at all.
When we look at stock value, both approaches – absolute and relative valuation – indicate that the stock is currently overvalued. Using a discounted cash flow model, we estimate the intrinsic value of the stock to be $52 per share. With the stock currently trading at $64 it appears to be overvalued by 23%. Relative valuation using multiples confirms that assessment. The stock is trading at a P/E ratio of 26 which is similar to its competitors. Considering several multiples we find that it is currently trading at a premium compared to its peers. On average, the multiples of the Coca Cola Company are 45% higher than those of its peers, with the strongest deviations in price/sales ratio (+107%) & enterprise value/revenue ratio(+90%).
Financial Analysis
Using our custom scoring model, the Coca Cola Company achieves 16 out of 19 total points, giving it a score of 84%. From the 76 companies that we are currently monitoring only 8 achieve a higher score. It scores particularly high on margins and earnings, achieving a full score in both categories. When we look at expenses, and debt we find that the company has moderately high amounts of both, which is good but not great and consequently leads to a lower score in these categories. The full table with performance metrics and scores is shown below.
| Performance indicator | Metric | Value | Score |
| Gross margin | Median | 59.5% | 2/2 |
| Gross margin | Coefficient of variation | 1.7% | 1/1 |
| SG&A expense rate | Median | 49.7% | 1/2 |
| Net income | Growth | 5.8% | 1/1 |
| Net income | Consistency | yes | 1/1 |
| Net margin | Median | 23.5% | 2/2 |
| Long term debt to earnings ratio | Median | 3.81 | 1/2 |
| Total liabilities to equity ratio | Median | 0.90 | 1/2 |
| Retained earnings | Growth | 2.9% | 1/1 |
| Share buybacks | Existence | yes | 1/1 |
| Return on equity | Median | 41.3% | 2/2 |
| CAPEX to earnings | Average | 15.6% | 2/2 |
| Total | 16/19 |
Margins
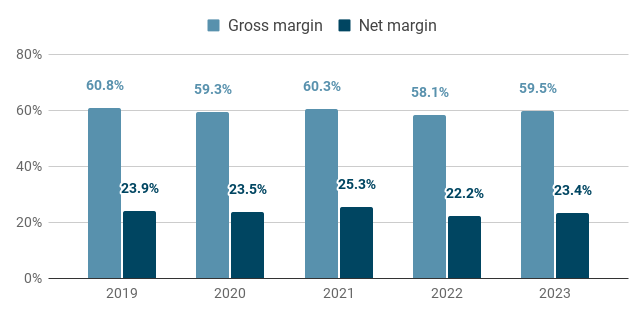
Coca Cola is a business with great margins and they can be summarized as “high and stable”. The median gross margin of the last 5 years was 60% and only marginally moved within the narrow range between 58% and 61%. They also enjoy a healthy net margin of 24% with similarly low variation over the years. Obviously, margins depend on the industry and the business model, but a company that can keep 24 cents of every dollar it earns likely built a strong moat working in its favor.
Earnings
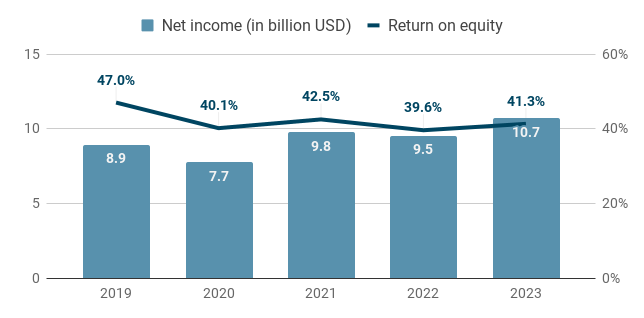
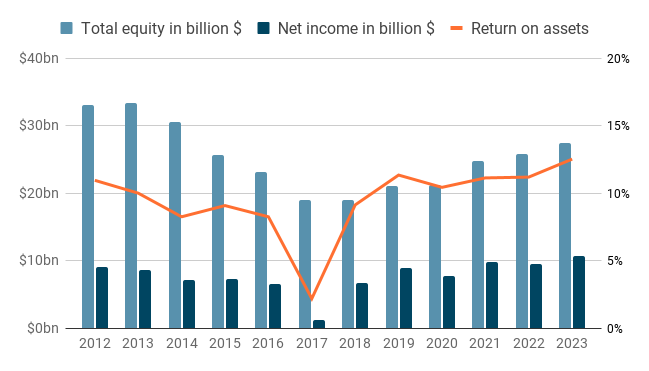
Net income has grown by about 6% per year for the past years reaching almost $11bn in 2023 and these earnings have been consistent, i.e. there were no years with losses. Return on equity is also high with a median of 41% over the past 5 years.
Expenses
On the expenses side we are going to look at two metrics: SG&A expense rate and the capital expenditures to earnings ratio. Median SG&A expenses over the past 5 years were just below 50% of gross profit – good but not great. Looking at the annual data, we can also see that the reporting changed: While for some years SG&A expenses have been almost synonymous with operating expenses, in recent years they have been separated.
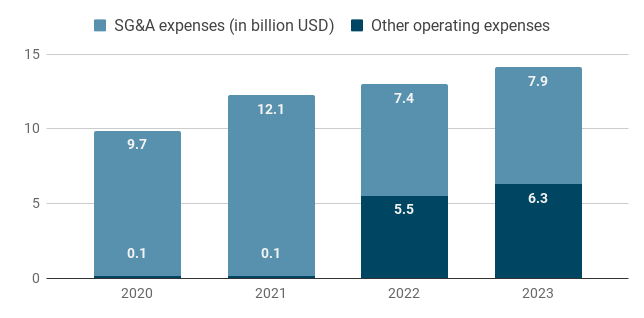
Using the now lower and more specific SG&A expenses, the expense rate drops to a more favorable 30%.
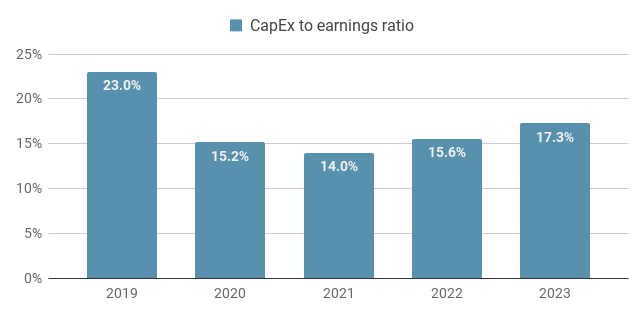
CAPEX to earnings ratio has been remarkably good during the entire period. The median of the last 5 years is 16% and it stayed below 18% in 4 of the last 5 years. Despite the fact that Coca Cola leverages its brand and scale to its advantage, at its heart it is still a company manufacturing a physical product. Considering this, it is quite impressive how it’s managing to keep capital expenditures that low.
Debt and equity
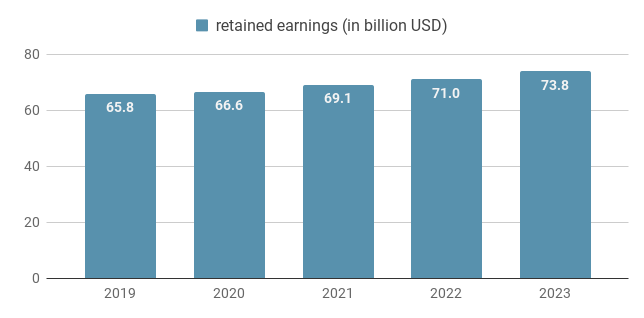
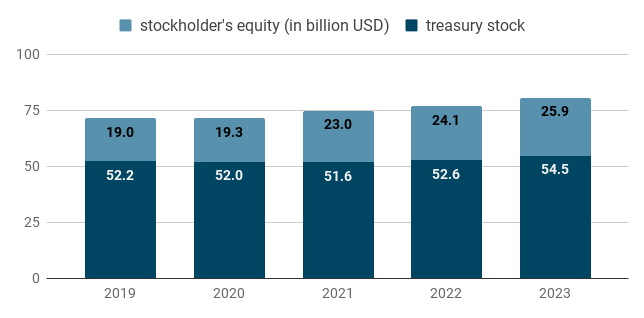
On the equity side, we find that retained earnings are growing steadily and consistently by about 3% every year. The company used to buy back a lot of its stock in the past, which is exemplified by the 2:1 ratio of equity to treasury stock, but hasn’t engaged much into share buybacks in recent years:
- There were 4.28 billion ordinary shares in 2019 and that number has increased to 4.31 billion in 2023
- There were 2.76 billion treasury shares in 2019 and that number has reduced to 2.73 in 2023
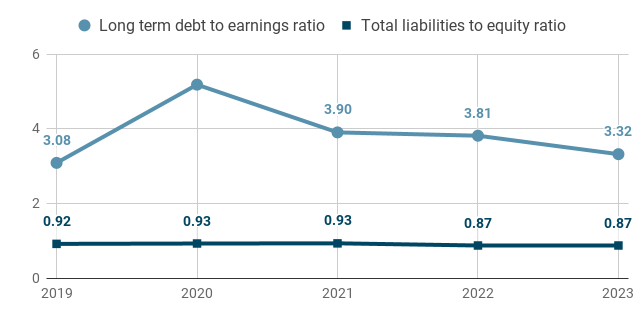
When it comes to debt, the company has a moderate amount on its balance sheet. The median long term debt to earnings ratio is an acceptable 3.8, meaning it would take about four years to pay it back. After a peak in 2020 it is on a trajectory to return to previous levels. The total liabilities to equity ratio is at a much more favorable 0.9 ratio and has moved in a rather confined narrow range between 0.87 and 0.93. That implies that the company rather uses its (strong) earnings to fund growth rather than tap into additional debt.
Competitive strength
Competitors
Using the company’s annual report, Yahoo Finance, Google and ChatGPT, we identify the following publicly traded companies as relevant competitors of the Coca Cola Company (sorted by market cap in US Dollar from high to low):
- Nestlé ($283bn): the world’s largest food and beverages company, headquartered in Switzerland
- PepsiCo ($226bn): an American multinational food and beverages company, best known for its product Pepsi that has a long standing rivalry with Coca Cola
- AB InBev ($117bn): a Belgian multinational drink and brewing company and the largest brewer in the world
- Diageo ($72bn): a British multinational alcoholic beverage company, particularly known for its vast number of whisky brands
- Heineken ($57bn): a Dutch multinational brewing company, best known for the lager beer of the same name
- Monster Beverage ($52bn): an American beverage company known for its energy drinks
- Keurig Dr Pepper ($46bn): an American beverage and coffee maker
- Danone ($41bn): a French multinational food products corporation with a focus on dairy products and water
- Celsius ($14bn): an American beverage company offering caffeinated drinks
- National Beverage ($4bn): an American beverage company focused on flavored soft drinks
- Primo Water ($4bn): an American-Canadian water company offering bottled water and water dispensers
While also relevant competitors, Red Bull from Austria and Suntory Beverage & Food from Japan didn’t make it on the comparison list because they are privately held companies.
Overall comparison
When we inspect the 4 metrics we use to gauge competitive strength, we find that Coca Cola outperforms the competition in 36 out of 44 comparisons ( 4 metrics times 11 competitors), i.e. it performs better in 82% of the cases – a very strong result. Looking at the performance of the top 3 competitors for each metric, we find that it still beats this benchmark for gross margin (+1.1%) and net margin (+4.0%) and trails in the other two metrics by about 4%. There is not a single competitor that beats Coca Cola in more than 1 metric and there are only 5 competitors that have a better performance in a single metric (PepsiCo, Diageo, Monster Beverage, Celsius, National Beverage).
| Metric | Coca Cola | Median of competitors | Average of top 3 competitors |
| Gross margin | 59.4% | 53.8% | 58.3% |
| Net margin | 23.4% | 10.0% | 19.5% |
| Return on equity | 40.7% | 12.6% | 44.7% |
| CapEx to earnings ratio | 15.4% | 45.5% | 11.2% |
To get a holistic picture that incorporates each company’s performance on all four metrics, we can rank them individually on each metric and compute the average rank per company. Here we find that Coca Cola doesn’t have the lead on any of the four metrics: it ranks second on gross and net margin and third on return on equity and CapEx to earnings ratio. However, consistently being very close to the top gives it the lowest average rank.
| Stock | Gross margin | Net margin | Return on equity | CAPEX to earnings | average rank |
| Coca Cola | 2 | 2 | 3 | 3 | 2.5 |
| Diageo | 1 | 3 | 4 | 6 | 3.5 |
| Monster | 6 | 1 | 6 | 2 | 3.8 |
| National | 11 | 4 | 2 | 4 | 5.3 |
| Pepsico | 7 | 7 | 1 | 8 | 5.8 |
| Keurig | 5 | 6 | 9 | 5 | 6.3 |
| Nestle | 9 | 5 | 5 | 7 | 6.5 |
| AB InBev | 4 | 8 | 10 | 11 | 8.3 |
| Celsius | 10 | 11 | 11 | 1 | 8.3 |
| Danone | 8 | 10 | 8 | 10 | 9.0 |
| Heineken | 12 | 9 | 7 | 9 | 9.3 |
| Primo | 3 | 12 | 12 | 12 | 9.8 |
Let’s dive into the details.
Margins
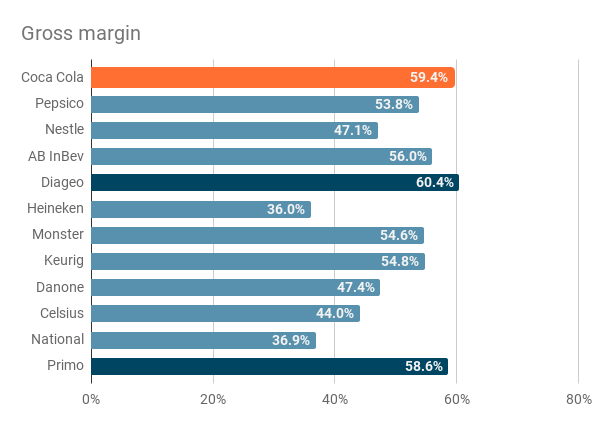
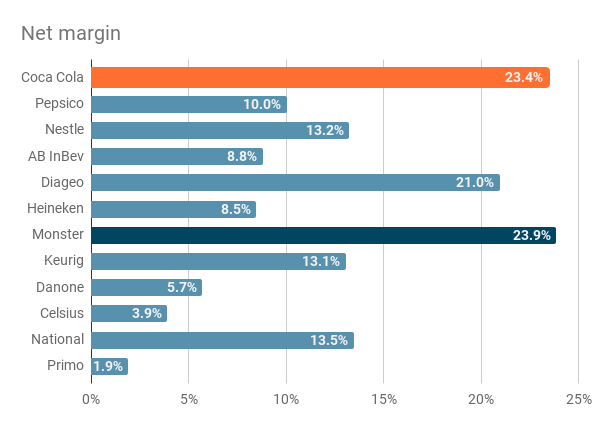
More than half of the companies enjoy juicy gross margins of 50% or more, thus the industry as whole is enjoying rather high margins. But only Coca Cola and two competitors (Diageo and Primo) get close to 60%. Looking at net margin, we see a much stronger separation between Coca Cola and its competitors: While Coca Cola boasts an excellent net margin of 23.4%, the median competitor only achieves a 10% margin – less than half. That is a strong testament to the strength of the brand and the time-tested product formula that allows the company to limit its overhead expenses. The notable exceptions are Monster Beverage at 23.9% (even surpassing Coca Cola) and Diageo at 21%
Return on equity and Capital expenditure to earnings ratio
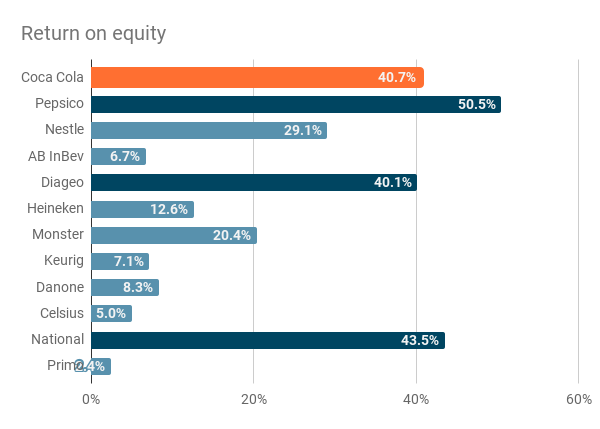
When we look at return on equity, we see how the competitors divide into two groups: 3 of them (PepsiCo, National Beverage, Diageo) compete with and even exceed Coca Cola’s return on equity of 40.7%, while the rest clearly lags behind with an average return on equity of 11.4%.
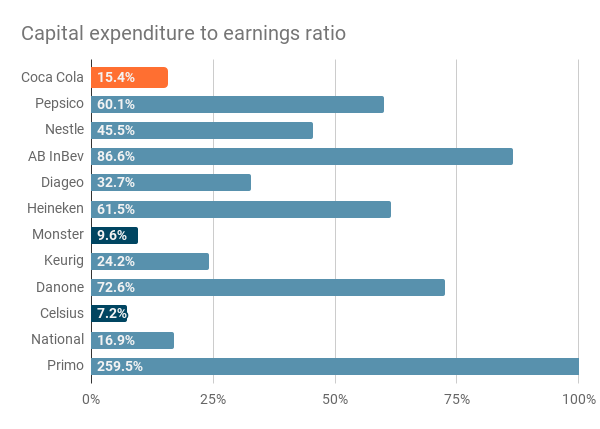
Looking at the ratio of capital expenditures to earnings, we find that the average competitor uses about 46% of its earnings for capital expenditures, which is significantly higher than the 15.4% that Coca Cola appropriates for that purpose. Only two competitors actually outperform Coca Cola on this metric: Monster Beverage with a ratio of 9.6% and Celsius with a mere 7.2%. Another small competitor (National Beverage) is close to the performance of Coca Cola with a CapEx to earnings ratio of 16.9%.
Intrinsic value
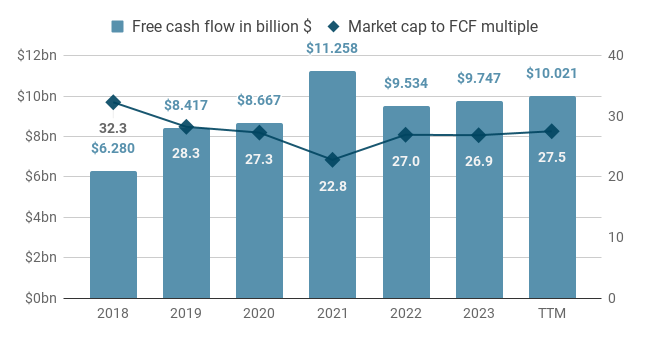
The average cash flow of the last 5 years, including the current business year is $9.85bn. It has grown steadily over the past years by about 6% per year and will likely break through the $10bn mark this year. The ratio between market capitalization and free cash flow has been quite stable, hovering around a multiple of 27 for the majority of the recent years.
Growth estimates
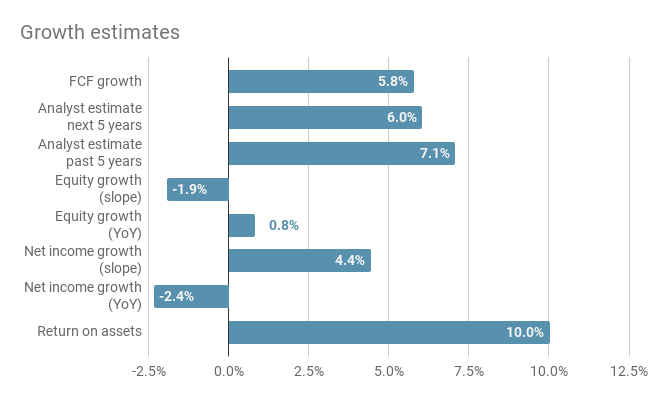
Analyst estimates for past and future growth are 6% and 7%, respectively. Over the past 10 years, equity growth exhibits a negative trajectory due to share buy back programs, but has reverted to positive growth in recent years. Net income shows a positive trend of 4.4% growth per year over the same period, albeit a strong dip in 2017 and a few more years with minor setbacks that pull down the median of year-over-year growth. Return on assets has been consistently above 10% for the past 5 years.
The average of these growth estimates is 3.7%, which is clearly distorted by the low equity growth rates. A falling amount of equity could be a sign of trouble, but given the strength of the company and its consistent earnings, it is rather a sign of strength, i.e. the company choses to buy back shares. In this case the median value is a much better estimate of future growth and stands at 5.1%
Discounted cash flow model
To summarize, for our intrinsic valuation we have:
- A current free cash flow of $9.85bn
- A growth rate of 5.1%
- A time frame of 10 years
- A terminal value multiple of 27 (based on the idea of buying and then selling the whole business for its market capitalization)
- A discount rate of 12%, which reflects our desired rate of return for the excess risk we are taking on by investing into a single stock as opposed to buying a bond or a market-wide passive index fund.
Plugging all these values into a standard discounted cash flow model, we obtain an intrinsic value of $225bn for the company, which is equivalent to $52 per share. Shares of Coca Cola are currently trading at 64$, thus the company seems moderately overvalued (+23%) according to our model.
Relative valuation using multiples
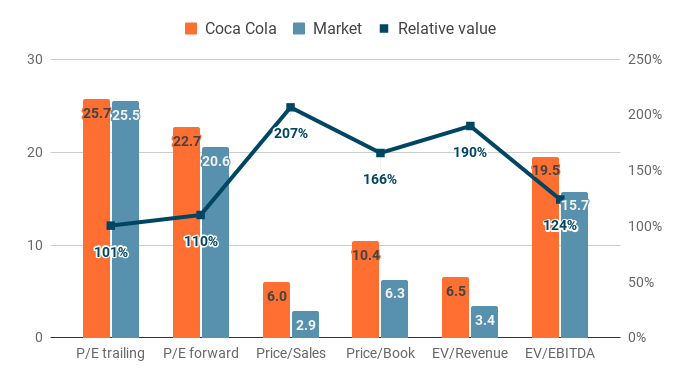
Coca Cola is currently trading at a trailing P/E ratio of 25.7. The median of the relevant market, i.e. the competitors, is trading at a ratio of 25.5, thus according to the P/E ratio, Coca Cola stock appears to be at fair value. The forward P/E ratio is lower than the trailing P/E ratio, implying a pessimistic outlook:
- Coca Cola: 25.7 trailing vs 22.7 forward
- Market: 25.5 trailing vs 20.6 forward
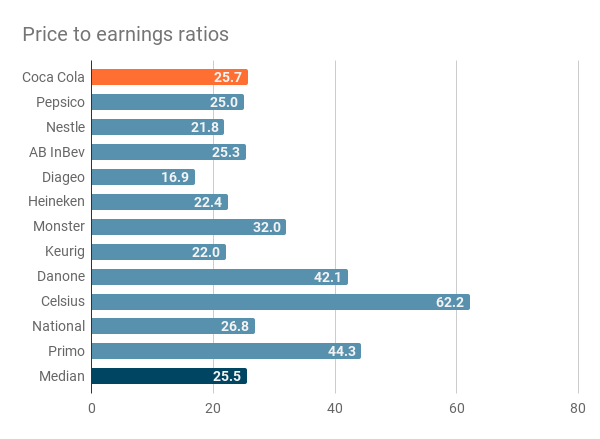
Multiplying Coca Cola’s current earnings per share of $2.49 and the median trailing P/E ratio of the market of 25.48 gives us an estimate of the share price of $63 for the scenario that the stock would “regress to the mean”. Given the similarity of the P/E ratios, we can’t expect any performance gains from this assumption.
The expected sales for 2024 and 2025 are $42.79bn (+8%) and $44.89bn (+13%), respectively. Applying the current price/sales ratio of the stock (6.01) provides us with an estimate of the price of $65, which is again similar to what it is currently trading at.
The estimated earnings per share for 2024 and 2025 are $2.64 (+6%) and $2.84 (+15%), respectively. Applying the 4 P/E ratios (trailing and forward for both the stock and the market) gives us an average estimate of the price of $64 with a range from $51 to $78.
When we look across different multiples, we find that Coca Cola is overvalued relative to its peers on most of the metrics. P/E ratios and EV/EBITDA exhibit the lowest relative value, ranging from 101% to 124%. Relative valuation with multiples based on sales or book value is much higher and ranges from 166% to 207%. Using the median of these relative valuations, we find that, overall, Coca Cola seems to be overvalued, having a value relative to its peers of 145% across all multiples.
Disclaimer: The content on this page is for informational and educational purposes only and does not constitute financial, investment, or trading advice. All opinions expressed are solely those of the author. There are risks associated with investing in securities, including the loss of invested capital. Past performance is not a guarantee or predictor of future results. The author is not responsible for any losses incurred as a result of the information provided.